Design Made Simple
AI Infographics Generator – Turn Data Into Visual Stories
Create polished, ready-to-post infographics in seconds. No design skills, no subscriptions—just credits and results.
Examples
See AI Infographics Generator in Action
Click any thumbnail to preview the output. Click "Try It Now" to open the generator pre-filled with the same setup.
Image Examples
AI Infographics Generator
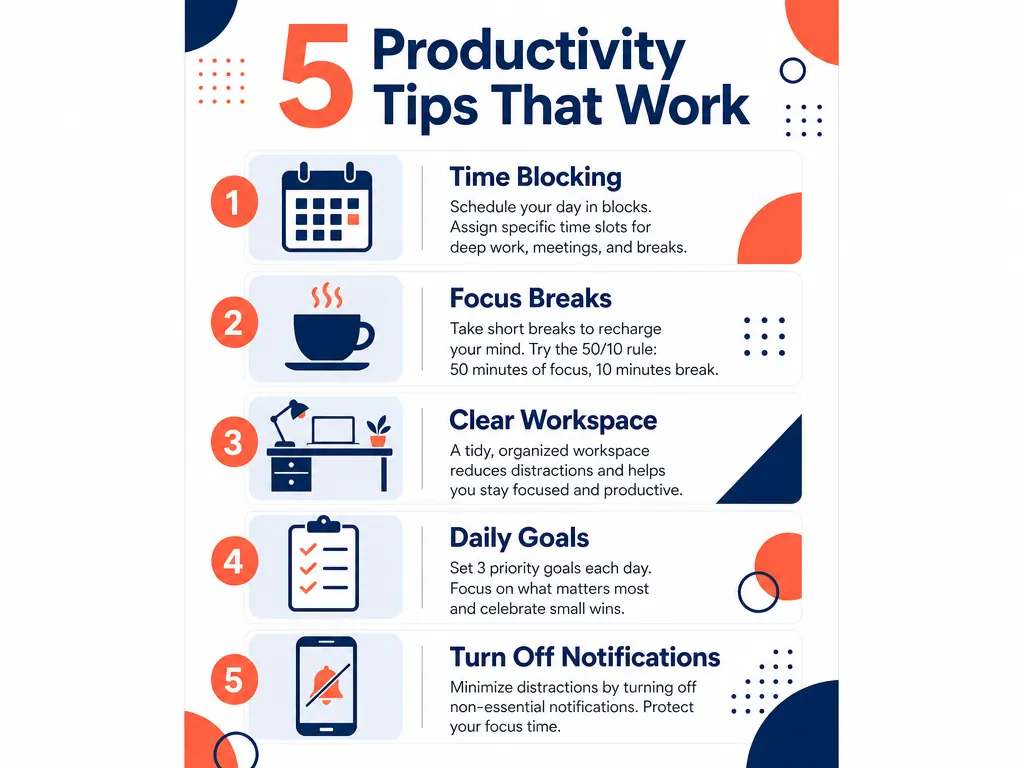
Workplace Tips
"Vertical 9:16 infographic poster about productivity tips for remote workers. Title at top reading '5 Productivity Tips That Work'. Five sections arranged vertically: 1) 'Time Blocking' with calendar icon, 2) 'Focus Breaks' with coffee cup icon, 3) 'Clear Workspace' with desk icon, 4) 'Daily Goals' with checklist icon, 5) 'Turn Off Notifications' with phone icon. Each section has icon on left, short text block on right. Color palette: navy blue and coral orange. Style: modern flat design with geometric shapes. Clean sans-serif typography, balanced composition, white background. No watermarks."
Try It Now →
Food Nutrition
"Vertical 4:5 infographic poster about nutrition fundamentals. Title at top reading 'Healthy Eating Habits'. Four sections stacked vertically: 1) 'Eat More Vegetables' with broccoli icon, 2) 'Stay Hydrated' with water glass icon, 3) 'Portion Control' with plate icon, 4) 'Limit Processed Foods' with crossed-out package icon. Each section features bold icon above short text description. Color palette: fresh green and warm yellow. Style: playful illustrated with hand-drawn elements. Friendly rounded typography, organic layout, cream background. No watermarks."
Try It Now →
Tech Trends
"Vertical 9:16 infographic poster about artificial intelligence in marketing. Title at top reading 'How AI is Changing Marketing'. Five sections with icons and text: 1) 'Personalization at Scale' with target icon, 2) 'Predictive Analytics' with graph icon, 3) 'Chatbot Support' with robot icon, 4) 'Content Generation' with document icon, 5) 'Ad Optimization' with megaphone icon. Color palette: electric purple and cyan blue. Style: bold editorial with strong contrast. Sharp modern typography, dynamic diagonal accents, light gray background. No watermarks."
Try It Now →
Environment
"Vertical 9:16 infographic poster about environmental science. Title at top reading 'Climate Change Facts You Should Know'. Four sections arranged vertically: 1) 'Global Temp Rising' with thermometer icon, 2) 'Ice Caps Melting' with iceberg icon, 3) 'Sea Levels Up' with wave icon, 4) 'Carbon Emissions High' with factory icon. Each section has circular icon and concise stat text. Color palette: earth green and ocean blue. Style: minimal monochrome with clean lines. Condensed typography, structured grid layout, white background. No watermarks."
Try It Now →
Work From Home
"Vertical 4:5 infographic poster about remote work strategies. Title at top reading 'Best Practices for Remote Work'. Five sections with icons: 1) 'Set Boundaries' with door icon, 2) 'Video Calls On' with camera icon, 3) 'Regular Check-ins' with calendar icon, 4) 'Dedicated Space' with home office icon, 5) 'Stay Connected' with chat bubble icon. Color palette: warm orange and deep teal. Style: corporate clean with professional aesthetic. Medium-weight sans-serif, centered alignment, off-white background. No watermarks."
Try It Now →
Finance
"Vertical 9:16 infographic poster about money management basics. Title at top reading 'Personal Finance Basics'. Four sections stacked: 1) 'Build Emergency Fund' with piggy bank icon, 2) 'Track Your Spending' with receipt icon, 3) 'Pay Off Debt' with credit card icon, 4) 'Invest Early' with growth chart icon. Each section features large icon with short explanatory text below. Color palette: gold yellow and forest green. Style: retro illustrated with vintage touches. Classic serif headlines, symmetrical composition, beige background. No watermarks."
Try It Now →
Travel
"Vertical 9:16 infographic poster about travel preparation. Title at top reading 'Travel Packing Checklist Essentials'. Five sections with checkmark icons: 1) 'Documents & ID' with passport icon, 2) 'Clothing Basics' with suitcase icon, 3) 'Toiletries Kit' with bag icon, 4) 'Electronics & Chargers' with phone icon, 5) 'First Aid Items' with medical cross icon. Color palette: sky blue and sunset pink. Style: modern flat with rounded corners. Friendly typography, spacious layout, white background. No watermarks."
Try It Now →
Fitness
"Vertical 4:5 infographic poster about fitness for beginners. Title at top reading 'Workout Routine Beginner Guide'. Four sections vertically arranged: 1) 'Warm Up 5 Min' with stretching icon, 2) 'Cardio 15 Min' with running icon, 3) 'Strength Training 20 Min' with dumbbell icon, 4) 'Cool Down 5 Min' with yoga icon. Each section shows duration and simple icon. Color palette: energetic red and charcoal gray. Style: bold editorial with high contrast. Strong geometric typography, angular elements, light background. No watermarks."
Try It Now →
Health Wellness
"Vertical 9:16 infographic poster about sleep health. Title at top reading 'Sleep Science Tips for Better Rest'. Five sections with icons and text: 1) 'Consistent Schedule' with clock icon, 2) 'Dark Room' with moon icon, 3) 'Cool Temperature' with thermometer icon, 4) 'No Screens' with crossed phone icon, 5) 'Limit Caffeine' with coffee cup icon. Color palette: calming lavender and soft navy. Style: minimal monochrome with gentle gradients. Light serif typography, peaceful composition, pale blue background. No watermarks."
Try It Now →
Marketing Tactics
"Vertical 9:16 infographic poster about social media strategy. Title at top reading 'Social Media Posting Schedule Guide'. Four sections showing timing: 1) 'Monday Morning: Motivation' with sunrise icon, 2) 'Wednesday Noon: Tips' with lightbulb icon, 3) 'Friday Evening: Fun Content' with party icon, 4) 'Sunday: Engagement' with heart icon. Each section has day, time, and content type. Color palette: vibrant magenta and bright turquoise. Style: playful illustrated with energetic vibe. Bold condensed type, asymmetric layout, white background. No watermarks."
Try It Now →
Tech Safety
"Vertical 4:5 infographic poster about online security. Title at top reading 'Cybersecurity Basics Everyone Needs'. Four sections arranged vertically: 1) 'Strong Passwords' with lock icon, 2) 'Two-Factor Auth' with shield icon, 3) 'Update Software' with refresh icon, 4) 'Beware Phishing' with warning icon. Each section features icon left-aligned with short text right. Color palette: tech blue and alert red. Style: corporate clean with professional look. Sans-serif medium weight, structured grid, light gray background. No watermarks."
Try It Now →
Lifestyle
"Vertical 9:16 infographic poster about eco-friendly living. Title at top reading 'Sustainable Living Tips to Start Today'. Five sections with icons: 1) 'Reusable Bags' with tote icon, 2) 'Reduce Plastic' with bottle icon, 3) 'Compost Waste' with bin icon, 4) 'Save Water' with faucet icon, 5) 'Buy Local' with market icon. Each section shows simple icon above brief action text. Color palette: natural green and earth brown. Style: retro illustrated with organic shapes. Handwritten-style headers, flowing layout, cream background. No watermarks."
Try It Now →
How It Works
Create in 4 Simple Steps
1
Describe Your Infographic
Write a prompt specifying your topic, section count, color palette, and style. For example: 'Vertical 9:16 infographic about 5 productivity tips. Title at top. Five sections with icons. Teal and coral palette. Modern flat style.'
2
Generate and Compare
Run your prompt through OpenAI GPT Image 2 or compare multiple models side-by-side. Review layout, typography, and icon quality to find the best match for your brand.
3
Download and Publish
Download your finished infographic in portrait format, ready for Pinterest, Instagram Stories, LinkedIn posts, or blog embeds. Use it immediately—no editing required.
4
Iterate for Campaigns
Create variations by adjusting colors, section titles, or style keywords. Build a library of on-brand infographics for ongoing content calendars and social campaigns.
The Problem & Solution
Why Choose AI for This?
⏱️
Before: Spending hours in design tools arranging icons, text blocks, and color palettes for a single infographic.
↓
With JAI Portal: Describe your topic in one prompt and receive a polished, ready-to-post infographic in under a minute.
💳
Before: Hiring freelance designers or subscribing to expensive design platforms for occasional visual content needs.
↓
With JAI Portal: Pay only for the infographics you generate with affordable per-use credits—no monthly commitment.
📊
Before: Struggling to make data and statistics visually engaging for social media audiences who scroll past text.
↓
With JAI Portal: Turn raw data into eye-catching visual stories that stop the scroll and drive shares on Instagram and Pinterest.
Overview
About AI Infographics Generator
An AI infographic generator transforms raw topics, statistics, and article ideas into polished visual graphics in seconds. Content marketers, social media managers, educators, and bloggers face the same challenge: turning information into shareable, eye-catching visuals that drive engagement on Pinterest, Instagram, LinkedIn, and beyond. Manual design tools demand hours of layout work, icon hunting, and color matching. JAI Portal's AI infographic generator solves this by letting you describe your topic and instantly receive a finished infographic—complete with title, sections, icons, and balanced typography—ready to download and publish.
JAI Portal gives you access to powerful AI infographic maker tools with a simple pay-as-you-go credit system. Start with 10 free credits, then pay only for what you generate—no monthly subscriptions, no hidden fees. Compare multiple AI models side-by-side to find the style that matches your brand. Whether you need a modern flat design for a corporate report or a playful illustrated layout for a classroom poster, JAI Portal's text to infographic AI handles it. Every output is yours to use commercially, from blog headers to pitch deck slides to social media carousels.
Nonprofits explaining impact metrics, startups building pitch visuals, online course creators designing lesson graphics, and journalists visualizing data all benefit from instant infographic creation. Instead of spending an afternoon in traditional design software, you describe your content once and receive a portrait-format graphic optimized for mobile feeds. JAI Portal makes professional data visualization accessible to anyone with a message to share—no design degree required.
Key Benefits
Why Content Creators Choose AI Infographic Generation
⚡
Minutes, Not Hours
Generate a complete infographic in under 60 seconds. Skip the layout grind, icon hunting, and color theory guesswork—get straight to publishing and promoting your content.
🎨
No Design Skills Required
Describe your topic in plain language and let AI handle typography, spacing, icon placement, and visual hierarchy. Perfect for marketers and educators who need professional results without a design background.
📱
Ready-to-Post Formats
Every infographic is generated in portrait 9:16 or 4:5 aspect ratios optimized for Pinterest, Instagram Stories, LinkedIn feeds, and mobile viewing—no cropping or resizing needed.
💼
Full Commercial Rights
Use your AI-generated infographics in client projects, pitch decks, course materials, blog posts, and social campaigns. You own the output—no attribution or licensing restrictions.
🔄
Compare Styles Instantly
Run the same topic through multiple AI models side-by-side to explore modern flat, bold editorial, playful illustrated, and minimal monochrome styles before choosing your final design.
💰
Pay Only Per Infographic
No monthly design tool subscriptions. Generate one infographic for a few credits or batch-create a dozen for a campaign—you control the budget and pay only for what you use.
Real-World Use Cases
Who Creates Infographics With AI
📢Content Marketers
Turn blog posts, whitepapers, and case studies into shareable Pinterest and LinkedIn graphics that drive traffic back to your website. Create visual summaries of long-form content in seconds.
📱Social Media Managers
Transform campaign data, product launch stats, and engagement metrics into eye-catching Instagram Stories and feed posts. Keep your content calendar full with fresh visuals every week.
🎓Educators and Teachers
Design classroom posters, lesson handouts, and study guides that explain complex topics visually. Help students retain information with clear, colorful infographics for history timelines, science processes, and math concepts.
✍️Bloggers and Writers
Illustrate articles with custom infographics that summarize key points, statistics, and how-to steps. Boost SEO with original visual content and increase time-on-page as readers engage with your graphics.
🌍Nonprofit Communicators
Explain your mission, impact metrics, and fundraising goals with donor-friendly infographics for annual reports, social media campaigns, and grant applications. Make complex data accessible and emotionally compelling.
🚀Startup Founders
Build pitch deck visuals, investor one-pagers, and product roadmap graphics without hiring a designer. Communicate your business model, market opportunity, and traction with professional infographics.
🎥Online Course Creators
Design lesson graphics, module summaries, and downloadable student resources for your courses. Turn bullet-point slides into engaging visual aids that improve comprehension and completion rates.
Pro Tips
Tips for Better AI Infographics
1
Specify Section CountTell the AI exactly how many sections you want (e.g., '5 tips', '3 steps', '7 facts'). This ensures balanced composition and prevents overcrowding or sparse layouts.
2
Name Your Color PaletteInclude 2-3 specific colors in your prompt (e.g., 'teal and coral', 'navy and gold', 'forest green and cream'). Consistent color schemes strengthen brand recognition and visual cohesion across multiple infographics.
3
Choose a Clear StyleSpecify 'modern flat', 'bold editorial', 'minimal monochrome', or 'playful illustrated' to guide the AI's design direction. Mixing styles across a campaign dilutes brand identity—pick one and iterate.
4
Keep Text ShortLimit each section to 3-5 words for titles and 10-15 words for descriptions. AI image models render text more accurately with shorter phrases, and concise copy is more scannable on mobile.
5
Request White or Light BackgroundsLight backgrounds ensure your infographic is readable on any platform and prints cleanly. Dark backgrounds can look dramatic but often reduce legibility on bright mobile screens.
6
Include Icon CuesMention 'with icons' or 'icon for each section' in your prompt. Icons break up text, add visual interest, and help viewers quickly identify each topic at a glance.
7
Test Multiple GenerationsRun the same prompt 2-3 times to explore layout variations. AI models introduce randomness—sometimes the second or third generation has better typography or icon placement than the first.
Related Use Cases
Explore More AI Use Cases
FAQ
Frequently Asked Questions
AI-generated infographics are raster images (PNG/JPG), so direct text editing requires importing into design software like Photoshop or Canva. For full editability, generate multiple variations with different prompts until you find the perfect design, or use the output as a visual reference to recreate in vector tools.
AI image models excel at layout and visual design but may not render complex numbers or charts with perfect accuracy. For data-heavy infographics with precise statistics, provide clear section labels in your prompt and verify all numbers in the output. Use AI for visual structure, then overlay exact data in post-production if needed.
Yes. All infographics you generate on JAI Portal are yours to use commercially—in client projects, social media campaigns, blog posts, pitch decks, course materials, and more. No attribution required, no licensing restrictions.
Infographics are typically delivered as high-resolution PNG or JPG files optimized for web and print. These formats work seamlessly with Pinterest, Instagram, LinkedIn, WordPress, and presentation software. For vector editing, you can trace the output in Illustrator or Figma.
While you can request 'no watermarks' in your prompt to keep the design clean, adding your own logo or brand mark requires post-generation editing in design software. Download the infographic, then overlay your branding in Canva, Photoshop, or any image editor before publishing.
Download your finished infographic as a PNG or JPG, then upload it directly to scheduling platforms like Buffer, Hootsuite, Later, or Sprout Social. The portrait 9:16 and 4:5 formats are pre-optimized for Instagram Stories, Pinterest pins, and LinkedIn posts—no resizing needed.
Ready To Get Started With Our AI Infographics Generator?
Start for free with 10 credits. No subscription required. Pay only for what you use.
Get Started Free